The Ultimate Reporting Solution Using SharePoint Task Lists
Preamble
------------------
We've all done it before, built a task list, exported SharePoint list data to excel, created a pivot table & chart to show status in each column. Below is a quick example of what you can get by doing something simple like that. It's great for getting a snapshot of the task list, but terrible for reporting on team performance.


What
------------------
Reporting isn't just about showing stats on how your tasks are tracking. Sure, it gives you an idea of what you have achieved over a set period of time which is great information for upper management. But it doesn't help you improve your customer experience.
I know what would happen. You would now be able to find all the bottlenecks in your process & start to resolve them one at a time. You would be able to see which staff perform better during certain phases of a task & you could fine tune your team into a well-oiled task destroying machine.
Why
------------------
I just told you. By implementing this solution are getting performance monitoring down to a granular level which allows you to surface bottlenecks in your process and sort that shit out.
How
------------------
I'm going to attempt to explain how to achieve this via diagrams & process maps because the step by step process would be slightly long!

Detailed view of workflow & each step that occurs at each stage:


References
------------------
I'm not covering any new ground, this has been drilled into us again and again. I'm just trying to deliver what's been offered previously in a more step-by-step approach. Here's where I particularly enjoyed reading about it:
PROVEIT! - Using Analytics to Drive SharePoint Adoption and ROI (Published by Mark Miller, Edited by Loren Johnson)
- In Particular, Chapter 4 (SharePoint Analytics) by Sadalit (Sadie) Van Buren
------------------
We've all done it before, built a task list, exported SharePoint list data to excel, created a pivot table & chart to show status in each column. Below is a quick example of what you can get by doing something simple like that. It's great for getting a snapshot of the task list, but terrible for reporting on team performance.

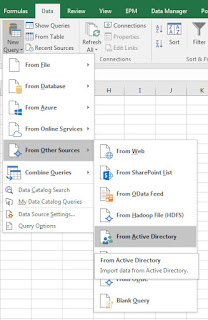
export to excel

Pivot-table & chart of a task list
What
------------------
Reporting isn't just about showing stats on how your tasks are tracking. Sure, it gives you an idea of what you have achieved over a set period of time which is great information for upper management. But it doesn't help you improve your customer experience.
- What if you could develop an automated report that could track every task individually?
- What if you could see how long a particular task sat at a particular status?
- What would happen if you found out that tasks spend most of their time in the 'On Hold' status?
I know what would happen. You would now be able to find all the bottlenecks in your process & start to resolve them one at a time. You would be able to see which staff perform better during certain phases of a task & you could fine tune your team into a well-oiled task destroying machine.
Why
------------------
I just told you. By implementing this solution are getting performance monitoring down to a granular level which allows you to surface bottlenecks in your process and sort that shit out.
How
------------------
I'm going to attempt to explain how to achieve this via diagrams & process maps because the step by step process would be slightly long!
- Create two lists. a Task List, used for logging each task and it's status. and a Task Logging List, used to hold all the logs for when tasks are updated. Here's a picture of the columns you need to include in each list
 |
 |
- Create a Workflow on your Task List that will run every time the status of a task changes. Here's a picture of the workflow process I went with:

Detailed view of workflow & each step that occurs at each stage:

- Export the Data to Excel & create a Pivot Report

References
------------------
I'm not covering any new ground, this has been drilled into us again and again. I'm just trying to deliver what's been offered previously in a more step-by-step approach. Here's where I particularly enjoyed reading about it:
PROVEIT! - Using Analytics to Drive SharePoint Adoption and ROI (Published by Mark Miller, Edited by Loren Johnson)
- In Particular, Chapter 4 (SharePoint Analytics) by Sadalit (Sadie) Van Buren

Comments
Post a Comment